3D Dashboard
Interactive 3D visualization dashboard for satellite data analysis.
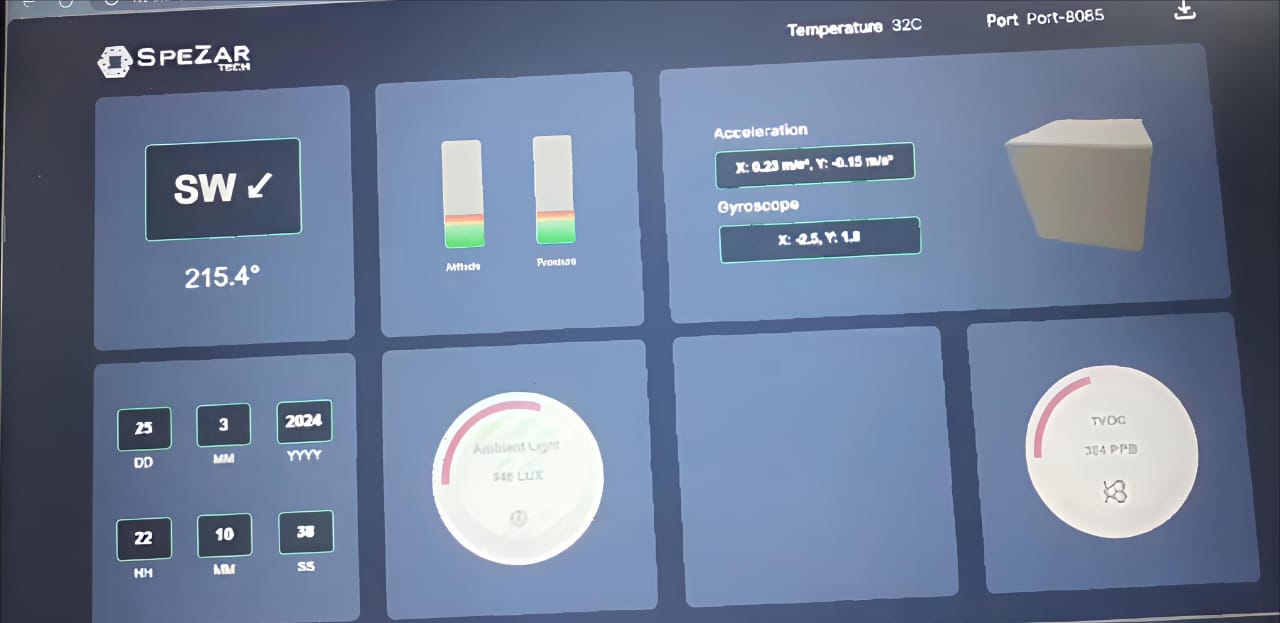
Overview
The 3D Dashboard is an innovative visualization platform for satellite data analysis. It provides interactive 3D representations of geographical data, allowing users to explore and analyze satellite imagery, terrain models, and environmental data in an immersive environment.
Features
- Interactive 3D globe visualization
- Real-time satellite data integration
- Terrain modeling and analysis
- Environmental data overlays
- Time-series data visualization
- Custom data import and export
- Collaborative viewing and annotation
Challenges
- Optimizing 3D rendering performance for large datasets
- Implementing intuitive navigation controls for 3D space
- Creating accurate geographical projections
- Building responsive visualizations that work across devices
Solution
We used Three.js with WebGL for high-performance 3D rendering, implemented custom controls for intuitive navigation, and designed a scalable architecture for handling large datasets. The MongoDB backend provides flexible storage for various data types and formats.
Outcome
The 3D Dashboard has been used by environmental researchers and satellite data analysts to gain insights from complex geographical data, improving decision-making and research outcomes.
Tech Stack
Links
Need a similar project?
I'm available for freelance projects and full-time opportunities.
Get in Touch